Segtools 1.3.1.dev0+gb8a5e19 documentation
- Homepage:
- Author:
Michael M. Hoffman <michael dot hoffman at utoronto dot ca>
- Organization:
Princess Margaret Cancer Centre
- Address:
Toronto Medical Discovery Tower 11-311, 101 College St, M5G 1L7, Toronto, Ontario, Canada
- Copyright:
2009-2012, Orion Buske; 2010-2016 Michael M. Hoffman
- Last updated:
Apr 14, 2023
Segtools is a Python package for analyzing genomic segmentations. The software efficiently calculates a variety of summary statistics and produces corresponding publication quality visualizations. The overall goal of Segtools is to provide a bird’s-eye view of complex genomic data sets, allowing researchers to easily generate and confirm hypotheses.
For an overview of the toolkit, please see the manuscript:
Buske OJ, Hoffman MM, Ponts N, Le Roch KG, Noble WS. Oct 2011. Exploratory analysis of genomic segmentations with Segtools. BMC Bioinformatics, 12:415; doi:10.1186/1471-2105-12-415
Please cite the manuscript if you use Segtools.
Note
For questions, comments, or troubleshooting, please refer to the support section.
Installation
With Bioconda, segtools can be installed with:
conda install segtools
Otherwise, Segtools requires the following prerequisites:
Python 3.7+, with Rpy2 2.1.3+
Zlib
Numpy 1.3+
R 2.10.0+, with latticeExtra and reshape packages
Once these prerequisites are properly installed, Segtools can be installed with:
pip install segtools
To use segtools-signal-distribution or segtools-nucleotide-frequency, the Python package, Genomedata, is also required.
Segmentations versus annotations
A segmentation is a division of a genome (or part of a genome) into non-overlapping segments, each of which is assigned one of a fixed set of labels. Ideally, segments that share a common label are somehow similar to one another, and vice versa. Segtools helps you identify the similarities and differences between these labels to help you understand the semantics of your segmentation.
Some of the Segtools commands take annotations as input, rather than segmentations. The only difference between an annotation and a segmentation is that an annotation may contain overlapping segments (i.e., a single base can be assigned more than one label). Hence, any tool that accepts an annotation as input will also accept a segmentation, but the converse is not true.
Note that neither segmentations nor annotations need to be exhaustive, in the sense that the complete genome is labeled.
Input
Segmentations should be in BED format or GFF format, with one
line for each segment and the name field used to specify the
segment label. Segments must be non-overlapping, and can span all,
part, or multiple parts of a genome. Genomic regions not spanned by
any segment are ignored, so it can sometimes be useful to have a
“background” label with segments that span all regions not covered by
another segmentation. Adding these labels can be automated with
segtools-flatten. For best results, the
number of unique segment labels should be between 2 and around 40. For
segmentations, Segtools uses fields 1-4 of a BED file or fields
1,3-5 of a GFF file.
Annotations (i.e., segmentations in which overlapping segments are allowed) may be specified in BED format, GFF format, or GTF format.
If you want to change the order in which labels appear or if you want
to change the text displayed in plots,
a mnemonic file can be
created. Segtools commands can then be re-run with the --replot
flag and the --mnemonic-file=<FILE> option to regenerate the plots
without redoing the computation.
Usage
The basic workflow for using key Segtools commands is shown below. Segmentations can also be created from other segmentations, annotations, or peak-calls using segtools-flatten.
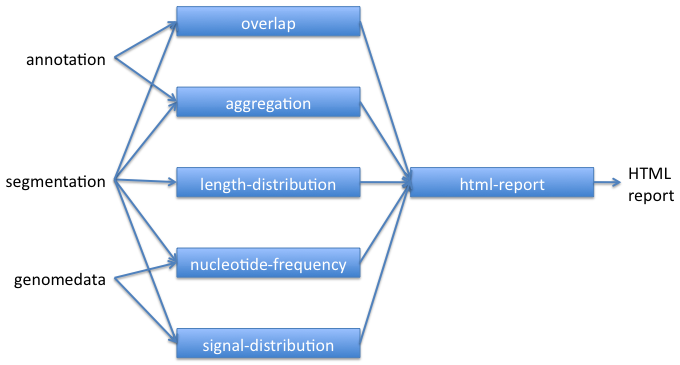
Segtools commands can be run through their command-line or Python interfaces.
Command-line interface
Commands that analyze a single segmentation:
segtools-length-distribution: Analyzes the distribution of segment lengths and their coverage of the genome for each segment label.
segtools-nucleotide-frequency: Analyzes the frequencies of nucleotides and dinucleotides in segments of each label.
segtools-transition: Analyzes the transitions between segment labels and the structure of their interaction.
Commands that compare a segmentation to an annotation:
segtools-aggregation: Analyzes the relative occurrence of each segment label around the provided genomic features.
segtools-feature-distance: Reports the distance from each segment to the nearest feature in each of a list of feature files.
segtools-overlap: Analyzes the frequency with which each segment label overlaps features of various types.
segtools-signal-distribution: Analyzes the distribution of genomic signal tracks for each segment label.
Segtools utilities:
segtools-compare: Measure base-wise edit distance between two segmentations.
segtools-flatten: General tool for flattening overlapping segments, but flattens them into segments defined by the set of segment labels that overlap the region.
segtools-html-report: Combines the output of the other commands and generates an html report for easier viewing.
segtools-preprocess: Preprocess segmentation and annotation files into a binary format that can be quickly re-read in future calls to Segtools commands.
segtools-relabel: Generate a new segmentation by relabeling the segments in one segmentation according to a mnemonic file.
Other commands:
- segtools-gmtk-parameters:
Analyzes GMTK emission parameters and state transitions.
All the above commands respond to -h and --help by displaying
usage information and options.
Where relevant, commands accept mnemonic files
through the --mnemonic-file option.
Each core command generates:
tab-delimited (
tab) data filesimage files (in
pngandpdfformat and in normal, thumbnail, and slide layouts), andpartial HTML (
div) files, which are used by segtools-html-report.
Common options
The following options are supported by all (or most) Segtools commands:
- --clobber
Overwrite existing output files if there is a conflict.
- --help, -h
Display usage information and options.
- --noplot
Perform computation and output tab files, but do not generate plots.
- --mnemonic-file <file>, -m <file>
Specify a mnemonic file to control the label display and ordering. See mnemonic file details.
- --outdir <dir>, -o <dir>
Specify the directory where output files should be placed (will be be generated if it does not exist).
- --quick
Output results after running command on only one chromosome (which chromosome is unspecified). This can be useful for testing.
- --quiet, -q
Don’t print diagnostic messages and status updates.
- --replot
Load tab file data generated from a previous run of this program and recreate plots instead of recomputing tab file data. Tab files are expected to be in the default or specified output directory (with –outdir).
- --version
Print the current program version.
- -R <PARAM=VAL>
Pass PARAM=VAL to any R functions called by the Segtools command. For example, -R “width.pdf=6” -R “height.pdf=6” could be specified to set the pdf plots generated by R to be 6 inches square.
Python interface
Segtools commands can be run directly from Python by importing the
corresponding module and running its main() method with the same
arguments you would specify on the command line. For instance, you could
run segtools-length-distribution -opt ARG from Python with the following:
>>> from segtools import length_distribution
>>> length_distribution.main(["-opt", "ARG"])
The commands and corresponding modules are as follows:
Command (segtools-…) |
Module |
|---|---|
aggregation |
aggregation |
compare |
compare |
feature-distance |
feature_distance |
flatten |
flatten |
html-report |
html |
length-distribution |
length_distribution |
nucleotide-frequency |
nucleotide_frequency |
overlap |
overlap |
preprocess |
preprocess |
relabel |
relabel |
signal-distribution |
signal_distribution |
transition |
transition |
gmtk-parameters |
gmtk-parameters |
Note: while all commands can be run using both Python 2 and Python 3, only those specified in the Python compatibility table will do so correctly.
Commands
Commands that analyze a single segmentation
segtools-length-distribution
This command summarizes the distribution of segment lengths, by label.
- Visualization:
A violin plot (a box plot, but instead of a box, it is a smoothed density curve)
- Visualization:
A simple bar chart that describes the overall label composition of the annotations file
- Summary file:
A table listing the number of segments of each label, the mean and median segment lengths, and the number of bases covered by each label.
Usage: segtools-length-distribution [OPTIONS] ANNOTATION
- Options:
- --version
show program’s version number and exit
- -h, --help
show this help message and exit
- Flags:
- --clobber
Overwrite any existing output files.
- -q, --quiet
Do not print diagnostic messages.
- --replot
Load data from output tab files and regenerate plots instead of recomputing data.
- --noplot
Do not generate any plots.
- --no-segments
Do not show total segments covered by labels in size plot
- --no-bases
Do not show total bases covered by labels in size plot
- Output:
- -m FILE, --mnemonic-file=FILE
If specified, labels will be shown using mnemonics found in FILE
- -o DIR, --outdir=DIR
File output directory (will be created if it does not exist) [default: length_distribution]
- R options:
- -R PARAM=VAL Pass VAL for PARAM when calling R functions. May be
specified multiple times.
Note
This command requires only an annotations file as a parameter and performs minimal computation. As such, it is a useful test to make sure Segtools works on your system.
Note
Since the violin plot is based upon a density distribution, the lengths of all the segments in the segmentation or annotations is saved in a tab file to allow this plot to be regenerated solely from R. Unfortunately, for large annotationss, this tab file can get very large (hundreds of megabytes). We hope to revise this by saving instead a histogram-like summary of the segment lengths instead of a separate length for each segment.
segtools-nucleotide-frequency
This command computes nucleotide and dinucleotide frequencies across labels in a segmentation of groups in an annotations file. The nucleotide sequence is specified by providing a Genomedata archive which allows efficient, low-memory operations on genomic sequences.
- Visualization:
A heatmap of the normalized dinucleotide frequencies across segment labels.
- Summary file:
A table of all nucleotide and dinucleotide frequencies.
Usage: segtools-nucleotide-frequency [OPTIONS] ANNOTATION GENOMEDATAFILE
- Options:
- --version
show program’s version number and exit
- -h, --help
show this help message and exit
- Flags:
- --clobber
Overwrite any existing output files.
- -q, --quiet
Do not print diagnostic messages.
- --quick
Compute values only for one chromosome.
- --replot
Load data from output tab files and regenerate plots instead of recomputing data.
- --noplot
Do not generate any plots.
- Output:
- -m FILE, --mnemonic-file=FILE
If specified, labels will be shown using mnemonics found in FILE
- -o DIR, --outdir=DIR
File output directory (will be created if it does not exist) [default: nucleotide_frequency]
- R options:
- -R PARAM=VAL Pass VAL for PARAM when calling R functions. May be
specified multiple times.
segtools-transition
This command takes a segmentation and computes the frequencies of all possible transitions between segment labels.
- Visualization:
A heatmap of transition frequencies between segment labels.
- Visualization:
A graph of the transitions between labels with frequencies exceeding a given threshold. The weight of an edge is a linear function of the transition frequency.
- Output file:
The transition graph in .dot format.
- Summary file:
A table of transition frequencies.
If a segment with label A is immediately followed by a segment with label B, then this is counted as one A->B transition. This command is thus most useful for segmentations that are a partition of large regions or the whole genome. If your segmentation consists of a collection of peak calls or regions of interest, then it is unlikely that there are many pairs of directly adjacent segments, and the results will be meaningless.
In many cases,
there will be at least one transition between every pair of segment
labels, making the transition graph fully connected. To make the
graph more interpretable, the transition frequencies can be
thresholded by value (--prob-threshold) or quantile
(--quantile-threshold) before drawing the edges.
Usage: segtools-transition [OPTIONS] SEGMENTATION
- Options:
- --version
show program’s version number and exit
- -h, --help
show this help message and exit
- Flags:
- --clobber
Overwrite any existing output files.
- -q, --quiet
Do not print diagnostic messages.
- --replot
Load data from output tab files and regenerate plots instead of recomputing data.
- --noplot
Do not generate any plots.
- --nograph
Do not generate transition graph
- Output:
- -m FILE, --mnemonic-file=FILE
If specified, labels will be shown using mnemonics found in FILE
- -o DIR, --outdir=DIR
File output directory (will be created if it does not exist) [default: transition]
- Transition frequency plot options:
- --dd, --dendrogram
include dendrogram along edge of levelplot [default: False]
- Transition graph options:
- -P VAL, --prob-threshold=VAL
ignore all transitions with probabilities below this absolute threshold [default: 0.15]
- -Q VAL, --quantile-threshold=VAL
ignore transitions with probabilities below this probability quantile [default: 0.0]
- Non-segmentation files:
- -g, --gmtk
The SEGMENTATION argument will instead be treated as a GMTK parameter file. If a mnemonic file is not specified, one will be created and used.
- R options:
- -R PARAM=VAL Pass VAL for PARAM when calling R functions. May be
specified multiple times.
Commands that compare a segmentation to an annotation
segtools-aggregation
This command looks at the aggregate occurrence of segment labels around and within a set of annotations.
- Visualization:
A graph showing the count or enrichment of each segment label on the y-axis and the position relative to the annotation on the x-axis.
- Output file:
A table of the aggregate count of each segment label at each interrogated position around the annotations.
A typical example of this would be to look at the relative occurrences of segment labels around transcription start sites (TSSs). You would do this with something like:
segtools-aggregation --normalize segmentation.bed tss.gff
If you have two different classes of TSSs that you were interested in
(say, expressed and unexpressed), you can use the third column of the
GFF file as a grouping variable and then specify the
--groups flag.
By default, the y-axis of the aggregation plot is the number of
segments of a given label that overlap a region. This is useful
in some applications, but more often you are interested in the
enrichment or depletion of various labels relative to what you
might expect by chance. This is especially true if the segments in
one label are significantly longer than those in another label.
In these cases, the --normalize flag should be used.
Usage: segtools-aggregation [OPTIONS] SEGMENTATION ANNOTATION
Plot the enrichment of the SEGMENTATION labels relative to the position of features in ANNOTATION. Features can be grouped by the ‘name’/’feature’ column by supplying –groups.
- Options:
- --version
show program’s version number and exit
- -h, --help
show this help message and exit
- Output options:
- -m FILE, --mnemonic-file=FILE
If specified, labels will be shown using mnemonics found in FILE
- -o DIR, --outdir=DIR
File output directory (will be created if it does not exist) [default: feature_aggregation]
- Flags:
- --clobber
Overwrite any existing output files.
- -q, --quiet
Do not print diagnostic messages.
- --quick
Compute values only for one chromosome.
- --replot
Load data from output tab files and regenerate plots instead of recomputing data.
- --noplot
Do not generate any plots.
- --groups
Separate data into different groups based upon ANNOTATION’s ‘name’/’feature’ field if –mode=region or –mode=point. Does nothing if –mode=gene.
- --normalize
Plot the relative frequency of SEGMENTATION labels, normalized by the number of segments in that group instead of the raw counts (normalize over SEGMENTATION labels)
- Main aggregation options:
- --mode=MODE
one of: point, region, gene. [default: point]
- -f N, --flank-bases=N
Aggregate this many base pairs off each end of feature or gene [default: 500]
- -r N, --region-samples=N
If –mode=region, aggregate over each internal feature by taking this many evenly-spaced samples. Warning: features with a length < N will be excluded from the results [default: 50]
- Gene aggregation options:
- -i N, --intron-samples=N
Aggregate over each intron by taking this many evenly- spaced samples [default: 50]
- -e N, --exon-samples=N
Aggregate over each exon by taking this many evenly- spaced samples [default: 25]
- R options:
- -R PARAM=VAL Pass VAL for PARAM when calling R functions. May be
specified multiple times.
Further description of selected options:
- --mode <mode>
Specify the aggregation mode. The following options are available:
point,region, andgene. The default ispoint.point: This mode aggregates around point-like features such as TSSs, TESs, or single-base peak calls. This mode looks at where segments occur in the 5’ and 3’ flanking regions of each feature. If the feature annotations have strand specifications (column 7), then the aggregation is strand-corrected so that the 5’ flank region is always upstream of the feature. The width (in base pairs) of these flanking regions can be set with the--flank-basesoption (default 500 bp).region: This mode aggregates around region-like features such as transcription factor binding sites, ChIP-seq peak calls, or promoter regions. This will be the appropriate mode for most annotations. This mode is similar topoint, but with the addition of aninternalregion which is aggregated over as well. To account for regions of varying length, evenly-spaced samples are taken from the span of each feature. The number of these samples can be set with--region-samples. Features that span fewer bases than this sample number are skipped.gene: This is a special mode for aggregating with respect to an idealized gene model. Rather than specifying a normal GFF file, the annotation file must be in GTF format and have features with namesexonandCDS, as provided by exporting data from the UCSC Table Browser in GTF format. This mode is similar toregion, but with many regions that correspond to idealized transcriptional and translational models of genes. For the transcriptional model, there are regions corresponding to initial, internal, and terminal exons and introns. For the translational model, there are initial, internal, and terminal 5’ and 3’ UTR regions, and initial and terminal CDSs. In the visualization output, each type of model is laid out in a logical progression so that genes are viewed in profile and gene-component-specific associations can be easily seen. Because introns and exons are typically different lengths, the--intron-samplesand--exon-samplesoptions allow you to specify the number of samples that are taken in these regions (like inregionmode). Note: If there are multiple transcripts with the same gene ID, then the longest transcript is used.
- --normalize
This option normalizes the y-axis of the aggregation plot, displaying enrichment and depletion instead of counts at each position. The enrichment of label
 at position
  is calculated with the following formula:
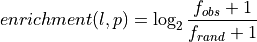
where
 is the observed overlap frequency and
 is the overlap frequency expected at random,
defined by:
is the overlap frequency expected at random,
defined by: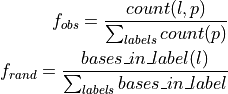
The enrichment is thus bounded by
![[-1,1]](_images/math/3e79b1d96f80fc611bf0f46645d37cc33614879f.png) , with 1
corresponding to extreme enrichment and -1 to extreme depletion.
, with 1
corresponding to extreme enrichment and -1 to extreme depletion.
- --groups
Group the features by the value of the third column of the GFF or GTF file (the
namefield). This option is useful if you want to compare aggregation profiles with respect to multiple classes of features, such as TSSs split by expression level or cell type.
segtools-feature-distance
This command takes a segmentation and one or more annotations files and prints the distance from each segment to the nearest annotation in each file. Results are printed in tab-delimited format on stdout:
chrom<TAB>start<TAB>end<TAB>label<TAB>...
where ... is a tab-delimited list of distances, one per annotation file.
This command can be used in conjunction with other command-line UNIX utilities to easily sort and filter segments by their distance from important genomics features. For example, given a segmentation from genomic insulator sites, you could use this command to find the 100 insulators farthest from any transcription start site. The command can also be used to filter segments that overlap annotation sets by filtering for distances of 0.
Usage: segtools-feature-distance [OPTIONS] SEGMENTATION ANNOTATION
Given a SEGMENTATION and ANNOTATION file, 1) prints the distance of each segment to the nearest feature in the ANNOTATION file (zero if the two overlap) and 2) generates a histogram of these distances. Distance is the difference between the nearest bases of the segment and the feature, so if there is one base pair between them, the distance is 2. Distances can be strand-corrected with respect to stranded features by specifying –stranded.
- Options:
- --version
show program’s version number and exit
- -h, --help
show this help message and exit
- Basic options:
- --clobber
Overwrite any existing output files.
- -q, --quiet
Do not print diagnostic messages.
- -s, --stranded
Strand correct features in the ANNOTATION file. If the feature contains strand information, the sign of the distance value is used to portray the relationship between the segment and the nearest stranded feature. A negative distance value indicates that the segment is nearest the 5’ end of the feature, whereas a positive value indicates the segment is nearest the 3’ end of the feature.
- Print options:
- -p, --print-nearest
The name of the nearest feature will be printed after each distance (with a space separating the two) for features from the ANNOTATION file. If multiple features are equally near (or overlap), it is undefined which will be printed
- -a, --all-overlapping
If multiple features in the ANNOTATION file overlap a segment, a separate line is printed for each overlapping segment-feature pair. This is most interesting with –print-nearest. Otherwise, the first overlapping segment will be used for printing.
- Plotting options:
- --noplot
Do not generate any plots.
- --replot
Load data from output tab files and regenerate plots instead of recomputing data.
- -n N, --n-bins=N
Number of bins to use in histogram for distances greater than zero and less than or equal to N*W. Distances of 0 and greater than N*W are placed in additional bins. If –stranded, N more bins are included in the negative direction and a bin for distances less than -N*W.
- -w W, --bin-width=W
Number of bases in each bin. If –stranded, bins cover distances of (-Inf,-N*W), …, [-W,0), [0], (0,W], …, (N*W,Inf). Otherwise, the bins cover distances of [0], (0,W], (W,2W], …, (N*W,Inf).
- Output options:
- -m FILE, --mnemonic-file=FILE
If specified, labels will be shown using mnemonics found in FILE
- -o DIR, --outdir=DIR
File output directory (will be created if it does not exist) [default: feature_distance]
- R options:
- -R PARAM=VAL Pass VAL for PARAM when calling R functions. May be
specified multiple times.
segtools-overlap
segtools-overlap [OPTIONS] SEGMENTATION ANNOTATIONS
This command measures the base-wise or segment-wise overlap between segments in a segmentation and in an annotation.
- Visualization:
A heatmap of the frequency of overlap between segment labels and annotation groups, with each row normalized to sum to 1.
- Visualization:
If
--by=bases, a cumulative precision-recall plot for the ability of segment labels to predict annotation groups, where labels are accumulated in order of decreasing precision.- Output file:
A confusion matrix of the number of overlaps between segment labels and annotation groups.
- Summary file:
A table of the precision and recall of each segment label with respect to each annotation group.
The primary output is a confusion matrix, computed at the base level or the
segment level. In the matrix, each row corresponds to one segment
label, each column corresponds to one annotation label, and each cell
indicates the amount of overlap between the corresponding pair of
labels. If --by=bases, the entry in cell (i,j) contains
the number of bases that are assigned the segment label i and the
annotation label j. If --by=segments, cell (i,j) contains
the number of segmentation segments with label i that overlap with
annotation segments with label j.
Usage: segtools-overlap [OPTIONS] SEGMENTATION ANNOTATION
SEGMENTATION and ANNOTATION files should be in BED, GFF, or GTF format (grouped on ‘name’/’feature’ columns). Results summarize the overlap of SEGMENTATION groups with ANNOTATION groups. The symmetric analysis can be performed by rerunning the program with the input file arguments swapped (and a different output directory).
- Options:
- --version
show program’s version number and exit
- -h, --help
show this help message and exit
- Flags:
- --clobber
Overwrite any existing output files.
- -q, --quiet
Do not print diagnostic messages.
- --quick
Compute values only for one chromosome.
- --replot
Load data from output tab files and regenerate plots instead of recomputing data.
- --noplot
Do not generate any plots.
- --cluster
Cluster rows and columns in heat map plot
- -p, --print-segments
For each group in the SEGMENTATION, a separate output file will be created that contains a list of all the segments that the group was found to overlap with. Output files are named overlap.segments.X.txt, where X is the name of the SEGMENTATION group.
- --max-contrast
Saturate color range instead of having it go from 0 to 1
- Parameters:
- -b MODE, --by=MODE
One of: [‘segments’, ‘bases’], which determines the definition of overlap. @segments: The value associated with two features overlapping will be 1 if they overlap, and 0 otherwise. @bases: The value associated with two features overlapping will be number of base pairs which they overlap. [default: bases]
- --min-overlap=N
The minimum number of base pairs that two features must overlap for them to be classified as overlapping. This integer can be either positive (features overlap only if they share at least this many bases) or negative (features overlap if there are no more than this many bases between them). Both a negative min- overlap and –by=bases cannot be specified together. [default: 1]
- Files:
- -m FILE, --mnemonic-file=FILE
If specified, labels will be shown using mnemonics found in FILE
- --feature-mnemonic-file=FILE
If specified, ANNOTATION groups will be shown using mnemonics found in FILE.
- -o DIR, --outdir=DIR
File output directory (will be created if it does not exist) [default: overlap]
- R options:
- -R PARAM=VAL Pass VAL for PARAM when calling R functions. May be
specified multiple times.
Additional description of selected options:
- --min-overlap <n>
This specifies the minimum number of bases that a segment and an annotation must overlap for that overlap to be counted. This number can be positive or negative, with
<n> = 1indicating that the segment and annotation must overlap by at least one base, a<n> = 0indicating that they can be directly adjacent, and<n> = -1indicating that there can be one base separation for them to still count as overlapping. The default value is 1.
Note
The precision-recall plot is only generated for base-wise overlap.
segtools-signal-distribution
This command takes a segmentation and a Genomedata archive and summarizes the distribution of values for each Genomedata track that fall within segments of each label.
- Visualization:
A heatmap of the mean value for each label-track pair, augmented with a bar representing the standard deviation of that value.
- Summary file:
A table of the mean, standard deviation, and number of data points for each label-track pair.
Parallelization:
Depending upon the segmentation and the Genomedata archive, this command can take a very long time to run. To help speed it up, you can parallelize the command by chromosome. To do this, you would first submit a job for each chromosome that doesn’t plot anything, then merge the results to generate the final output. Here is sample pseudocode:
indirs = []
for <chrom> in <chroms>
  outdir = sub_<chrom>
  submit_job --name=<run_id> segtools-signal-distribution --noplot --chrom=<chrom> --outdir=<outdir>
  indirs.add("--indir=" + <outdir>)

submit_job --hold_on=<run_id> segtools-signal-distribution --indirs=<indirs>
Usage: segtools-signal-distribution [OPTIONS] SEGMENTATION GENOMEDATAFILE
- Options:
- --version
show program’s version number and exit
- -h, --help
show this help message and exit
- Flags:
- --clobber
Overwrite any existing output files.
- -q, --quiet
Do not print diagnostic messages.
- --quick
Compute values only for one chromosome.
- --noplot
Do not generate any plots.
- --replot
Load data from output tab files and regenerate plots instead of recomputing data.
- --create-mnemonics
If mnemonics are not specified, they will be created and used for plotting
- I/O options:
- -t TRANSFORMATION, --transformation=TRANSFORMATION
Applies the transformation on the data upon reading from genomedata.The default is None, and currently only ‘arcsinh’ is implemented.
- -c CHROM, --chrom=CHROM
Only perform the analysis on data in CHROM, where CHROM is a chromosome name such as chr21 or chrX (option can be used multiple times to allow multiple chromosomes)
- --order-tracks=FILE
If specified, tracks will be displayed in the order in FILE. FILE must be a permutation of all the printed tracks, one per line, exact matches only.
- --order-labels=FILE
If specified, label will be displayed in the order in FILE. FILE must be a permutation of all the labels (after substituting with mnemonics, if specified), one per line, exact matches only.
- -i DIR, --indir=DIR
Load data from this directory. This directory should be the output directory of a previous run of this module. This option can be specified multiple times to merge previous results together.
- -m FILE, --mnemonic-file=FILE
If specified, labels will be shown using mnemonics found in FILE
- -o DIR, --outdir=DIR
File output directory (will be created if it does not exist) [default: signal_distribution]
- R options:
- -R PARAM=VAL Pass VAL for PARAM when calling R functions. May be
specified multiple times.
Additional description of selected options:
- --chrom <chrom>, -c <chrom>
Restrict the analysis to the single chromosome specified. This option is useful in parallelizing this command.
<chrom>must exactly match a chromosome in the Genomedata archive (genome[<chrom>]must be valid).
- --create-mnemonics
Use the hierarchically-clustered heatmap of mean values to generate mnemonics for the segmentation labels. The mnemonic labels are of the form:
X.Y, whereXis the group number andYis the index in that group.
- --indir <dir>, -i <dir>
Load data from the output directory of a previous run of this command. This option can be specified multiple times, making it useful for parallelizing this command, since multiple results can be merged together to generate the final output.
- --transformation <transformation>, -t <transformation>
Transforms data upon reading from genomedata archive. This is desired when comparing gmtk parameters with signal distribution because Segway transforms data by default.
Segtools utilities
segtools-compare
This command compares two segmentations by a specified metric. Currently,
the only supported metric is --edit-distance.
Usage: segtools-compare [OPTIONS] SEGMENTATION SEGMENTATION
Compare two segmentations
- Options:
- --version
show program’s version number and exit
- -h, --help
show this help message and exit
- -d, --edit-distance
Measure the base-wise edit distance between the two specified segmentations
- --quick
Compute values only for one chromosome.
- -q, --quiet
Do not print diagnostic messages.
segtools-flatten
This command takes multiple segmentations and combinatorially flattens them into one. Thus, there is a segment boundary in the new segmentation for every segment boundary in any of the input segmentations. The label for each new segment is a concatenation of the labels for segments that overlap this segment. We hope to expand this to support annotations files in the near future.
For example, given two files of regions of high transcription factor binding, one with peak calls and one with a lower threshold, you could create a single segmentation from the two files with:
segtools-flatten peaks.gff regions.bed.gz
The new segmentation would have one segment label for bases that are
covered by regions.bed.gz but not peaks.gff, one for bases covered by
both files, and one for bases covered by only peaks.gff (if there are
any). The command prints the new segmentation in BED format to
standard output, by default, but --mnemonic-file and --outfile
can be specified to create a segmentation file with a corresponding
mnemonic file that can be used in further
Segtools analyses.
Usage: segtools-flatten [OPTIONS] SEGMENTATION…
Combine segments from all SEGMENTATION files, labeling with unique labels for each combination of overlapping that occurs. Outputs a bed file on stdout (-o to change), and generates a file in the current directory that describes the generated labels (use -m to change).
- Options:
- --version
show program’s version number and exit
- -h, --help
show this help message and exit
- -q, --quiet
Do not print diagnostic messages.
- -m FILE, --mnemonic-file=FILE
Save mapping information to FILE instead of flat.mnemonics (default). This file complies with the mnemonic file format.
- -o FILE, --outfile=FILE
Save flattened bed file to FILE instead of printing to stdout (default)
- -f F, --filter=F
Don’t output new segment labels (and corresponding segments) that span less than F*N bases, where N is the number of bases covered by the new segmentation. This can be used to remove extremely uncommon labels (e.g. F = 0.01) that are the more likely to be spurious. Filtering is off by default.
segtools-html-report
This command is intended to be run after other Segtools
commands. Starting in the current working directory (or directory
provided with --results-dir), the command finds files produced by
the other Segtools commands (files matching */*.div) and compiles
the results into an HTML report for review. Run it in the parent
directory of these directories.
The SEGMENTATION argument and --mnemonic-file option
should be the same as used to run the other Segtools commands.
Usage: segtools-html-report [OPTIONS] SEGMENTATION
- Options:
- --version
show program’s version number and exit
- -h, --help
show this help message and exit
- Flags:
- --clobber
Overwrite any existing output files.
- -q, --quiet
Do not print diagnostic messages.
- Linking:
- -m FILE, --mnemonic-file=FILE
If specified, this mnemonic mapping will be included in the report (this should be the same mnemonic file used by the individual modules).
- -L FILE, --layered-bed=FILE
If specified, this layered BED file will be linked into the the HTML document (assumed to be the same data as in SEGMENTATION)
- -B FILE, --big-bed=FILE
If specified, this bigBed file will be linked into the the HTML document and a UCSC genome brower link will be generated for it (assumed to be the same data as in SEGMENTATION)
- Output:
- --results-dir=DIR
This should be the directory containing all the module output directories (ls should return things like “length_distribution/”, etc) [default: .]
- -o FILE, --outfile=FILE
HTML report file (must be in current directory or the links will break [default: index.html]
segtools-preprocess
This command takes a segmentation or annotations file (INFILE) and generates
a binary, preprocessed file (INFILE.pkl) that can be quickly loaded in
subsequent calls to Segtools commands. This is especially useful if you want
to run many Segtools commands on one segmentation. If you don’t preprocess
the segmentation, each Segtools command parses the segmentation file
independently. If the segmentation is large, this can add an hour
or more to the runtime of each Segtools command. Preprocessing cuts
this load time to just a few seconds. See --help for more details.
If you specify OUTFILE, .pkl.gz will be added on to its end for you, so there is no need to add it on yourself.
Usage: segtools-preprocess [OPTIONS] INFILE [OUTFILE]
If Segtools is taking too long to parse your large segmentation or annotation file (specify –annotation), this tool allows you to pre-process that file only once and have it load much faster in the future. INFILE will be parsed to create a special binary file with a name of the form: “INFILE.pkl” or “OUTFILE.pkl”. Then, you can substitute this new file for the corresponding SEGMENTATION or ANNOTATION argument in future Segtools calls and Segtools will parse it in much faster (but be sure to keep the “.pkl” extension intact)!
- Options:
- --version
show program’s version number and exit
- -h, --help
show this help message and exit
- --clobber
Overwrite any existing output files.
- -q, --quiet
Do not print diagnostic messages.
- --annotation
Read INFILE as an annotation, rather than as a segmentation (default).
segtools-relabel
This command generates a new segmentation by remapping the labels in a segmentation according to a mnemonic file. Multiple old labels can be mapped to the same new label. Immediately adjacent segments that have the same new label are merged, so that in the new segmentation, no two consecutive segments have the same label.
Usage: segtools-relabel [OPTIONS] SEGMENTATION MNEMONICFILE
Generates a new segmentation by first relabeling the segments in a given SEGMENTATION according to the label mappings in MNEMONICFILE and then merging overlapping segments with the same final label. Outputs the new segmentation in bed format to stdout (-o to change).
- Options:
- --version
show program’s version number and exit
- -h, --help
show this help message and exit
- -q, --quiet
Do not print diagnostic messages.
- -o FILE, --outfile=FILE
Save relabeled bed file to FILE instead of printing to stdout (default)
Other commands
segtools-gmtk-parameters
This command analyzes the dynamic Bayesian network emission parameters
generated by GMTK.
This command just calls the relevant parts of other commands,
generating transition plots, a transition graph, and a heatmap
of the mean and standard deviation values for each label and track.
See --help for more information.
Usage: segtools-gmtk-parameters [OPTIONS] PARAMSFILE
- Options:
- --version
show program’s version number and exit
- -h, --help
show this help message and exit
- Flags:
- --clobber
Overwrite any existing output files.
- -q, --quiet
Do not print diagnostic messages.
- --noplot
Do not generate any plots.
- --nograph
Do not generate transition graph.
- --create-mnemonics
If mnemonics are not specified, they will be created and used for plotting
- --allow-regex
If a file is specified with –trackname-translation, the mappings in this file will be interpreted as regular expressions instead of exact mappings. Thus, all underscores could be converted to periods with the single line: _<TAB>.. Mappings will be applied sequentially, so a second line of: .<TAB># would (together with the first line) convert all periods and underscores to pounds.
- Output:
- -m FILE, --mnemonic-file=FILE
If specified, labels will be shown using mnemonics found in FILE
- -o DIR, --outdir=DIR
File output directory (will be created if it does not exist) [default: gmtk_parameters]
- -t FILE, --trackname-translation=FILE
Should be a file with rows <old-trackname><TAB><new- trackname>. Tracknames will be translated using this mapping before plotting the stats plot. By default, <old-trackname> must exactly match the name of a track, but –allow-regex provides more flexibility.
- Transition graph options:
- -P VAL, --prob-threshold=VAL
ignore all transitions with probabilities below this absolute threshold [default: 0.15]
- -Q VAL, --quantile-threshold=VAL
ignore transitions with probabilities below this probability quantile [default: 0.0]
- --gene-graph
Make each node of the graph a reference to a .ps image an “image” subdirectory. Currently, these .ps files need to be made separately.
- R options:
- -R PARAM=VAL Pass VAL for PARAM when calling R functions. May be
specified multiple times.
Mnemonics
Mnemonic files are supported by most of the Segtools commands and provide a way to rename and reorder the displayed labels without repeating the full analysis. Mnemonic files must contain two or three tab-separated columns and must contain start with the following header (the description column is optional):
old{TAB}new[{TAB}description]
Renaming:
Each line of the mnemonic file specifies a mapping from the “old” name (the one appearing in the segmentation file) to the “new” name (the one to be displayed). Because the new name must fit into small spaces in plots (such as axis labels), this field should not be longer than a few characters (such as “I” for insulator). Longer descriptions can be specified in the description column.
Reordering:
The order of the lines in the mnemonic file determines the order the labels will be shown in plots.
Example:
If the segmentation file contains segments with labels of A, B,
and C, but you want A to be displayed as A1,
C to be displayed as A2, and the two of them to be next to
each other in plots, then you should construct the following mnemonic file:
old   new
A     A1
C     A2
B     B
Including the B line is not necessary, but it makes it easier to
reorder the labels later (for instance, if you want B to come first).
A description column could also have been included. This file should be
saved as something like second_try.mnemonics and should be passed
into Segtools commands with --mnemonic-file=/path/to/second_try.mnemonics.
If you had previously run Segtools commands on the segmentation before
creating these mnemonics, you could speed up the plot corrections by
using the commands’ --replot option (all other options and
arguments should still be specified to ensure correctness).
Support
For support of Segtools, please write to the <segtools-users@uw.edu> mailing list, rather than writing the authors directly. Using the mailing list will get your question answered more quickly. The mailing list also allows us to pool knowledge and reduce the number of repeated inquiries. You can subscribe here:
If you want to report a bug or request a feature, please do so using our issue tracker:
If you do not want to read discussions about other people’s use of Segtools, but would like to hear about new releases and other important information, please subscribe to <segtools-announce@uw.edu> by visiting this web page: